The Shortest Home Run and Some Other Acts of Baseball Tomfoolery
Written 05-09-2026
The Shortest Home Run
On April 21st, one of the White Sox’s top prospects and Italian World Baseball Classic darling, Sam Antonacci, notched one of the weirder hits in Major League Baseball history. The game situation was a low-leverage one -- the Sox held an 8-3 lead in the top of the ninth inning over the hosting Diamondbacks with a runner on base. Sam Antonacci, only a few days removed from his MLB debut, stepped up to the plate and hit a grounder at 88.1 MPH off the bat that barely stayed fair. As it dribbled into foul territory past third base the Diamondbacks’ ballperson, thinking that the ball was foul, went to pick it up but missed the catch that would have deadened the ball. As it awkwardly ricocheted off the left field wall at Chase Field, the Diamondbacks’ left fielder, Lourdes Gurriel Jr., gave up on the play due to the ballperson’s involvement as Antonacci rounded the bases. Gurriel eventually throws it to the infield, but it’s too late as Antonacci slides into home and makes the game 10-3 and Gurriel stands in disbelief. The replay in slow-motion is even more damning: the ball bends past the foul line and makes contact with the ballperson’s glove. Despite this, the call is upheld and etched in the play-by-play report of the game as a ridiculous “Home Run to LF (Ground Ball).” This moment got me thinking: baseball fans are always talking about the long balls such as Adam Dunn’s 535-foot blast that likely crossed state lines or the 485-ish-foot moonshot off of Troy Percival in the World Series by MLB’s home run king, Barry Bonds. However, measuring out at 57 feet away from home plate, is this the shortest home run in MLB history?
The answer to this question is, somehow, no. There have been 23 recorded ground ball home runs in MLB history including Antonacci’s, and only three since 2010. The two videos I was able to find of these exceedingly rare hits were both from this 2010 season, and I believe the others are lost media at this point. However, one of the videos contained a hit that was undeniably shorter by outfielder Chris Denorfia against the Dodgers. Dodgers’ pitcher Octavio Dotel threw a fastball that veered inside towards Denorfia’s bat but still headed hard towards the ground, landing at Denorfia’s feet before bouncing high and far in the air towards third base. The Dodgers’ third baseman Casey Blake barely missed a grab with an outstretched arm that possibly made contact with his glove (the video is too old to fully tell) and the Dodgers’ left fielder, my beloved 2005 World Series champion Scott Podsednik, misjudged the shallow bounce the ball took off the wall and chased it into the corner of the stadium. Denorfia looked up as he rounded second base, saw Podsednik bent over and fumbling the ball, and charged forwards. The throw from Podsednik to a Dodgers’ infielder that was either Ryan Theriot or Jamey Carroll (again, old video so it’s tough to tell numbers) was clean and the throw from the infielder to home was on-line but late as Denorfia slid in for the home run. With that slide, Chris Denorfia became the owner of the shortest verifiable home run in baseball history.
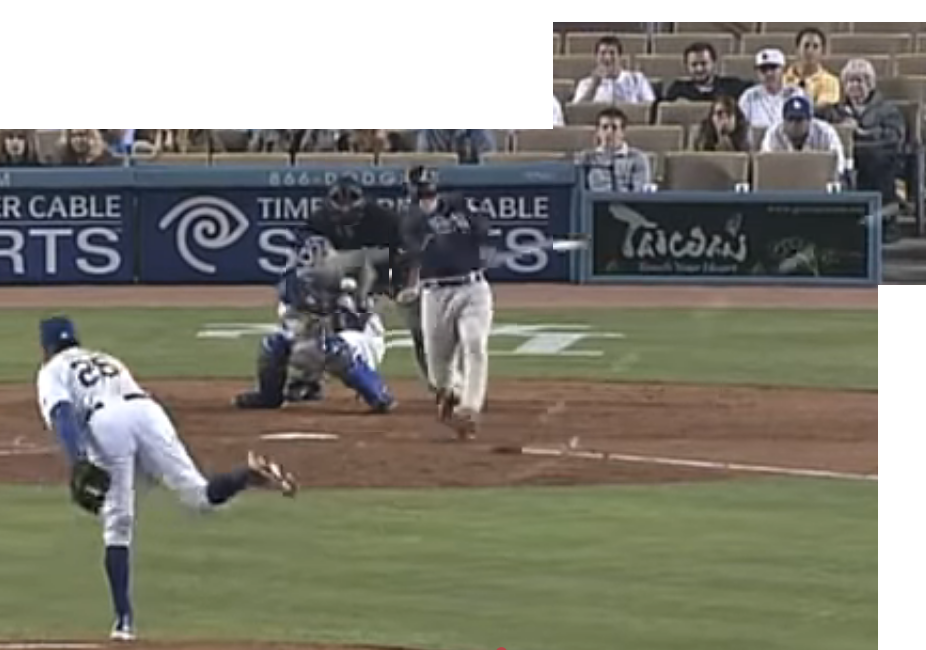
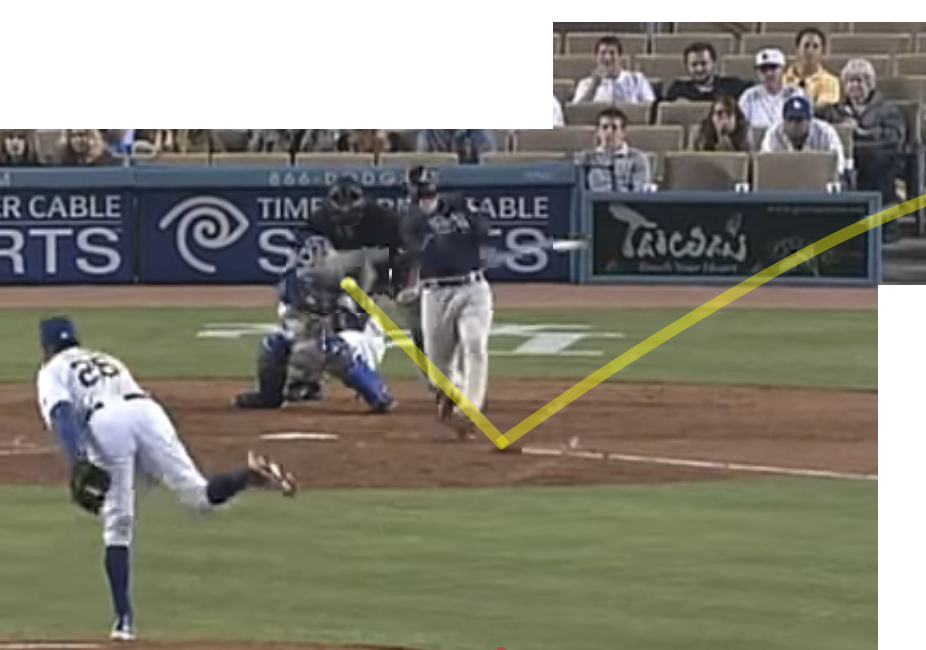
A frame-by-frame overlay of the moment before Chris Denorfia hit his home run, with the same image on the right having the ball’s path highlighted.
Hit distance is measured by taking the straight-line distance from the point of home plate (called the “rear point” in the MLB rulebook) to the point the baseball touches the ground. For fly balls that land outside of the field, this is calculated using the launch angle, exit velocity, and field conditions. For those that land in the field, it’s a bit more straightforward as we can see where the ball lands. According to the 2010 MLB rulebook, the circle containing the batter’s boxes has a radius of 13 feet and is centered at the rear point of home plate. The foul lines extend at a right angle from the rear point, meaning that from the video we can make a somewhat accurate estimate of how far this ball travelled. By some back-of-napkin math, I have the ball landing somewhere between 5 feet and 5 feet, 4 inches beyond home plate. This is verifiable by comparing the hit to other similar hits during the StatCast era that have a recorded distance of 5 feet. If you are 5’4” or taller reading this, congratulations: you are taller than a home run. Antonacci’s antics led me to this delightful Denorfia hit, which led me down a deeper rabbit hole: what are a few superlatives that baseball fans hold in high regard, and what is the opposite?
The Slowest Pitches
The fastest recorded pitch, since tracking began in 2008, was a fastball by Aroldis Chapman in 2010 that clocked in at 105.8 miles per hour against Tony Gwinn (also a member of the 2010 Padres discussed above). Chapman also owns most of the other spots in the top 10. The fastest recorded strike was thrown by Ben Joyce in 2024 at a scorching 105.5 miles per hour that just slipped past the bat of Tommy Edman, who impressively timed it up but was low on the swing. Both pitches stretch the limitations of what we think is possible for a human to do on a baseball diamond and is mind-boggling for me to even think about. However, the opposite is interesting to think about as well -- if a pitch is too slow, it won’t make it to the mound unless it has a perfect 45-degree arc. Applying some kinematics to the problem tells us that the slowest a pitch could realistically be while making it to home plate, and therefore having a chance of being a strike, is in the 26-28 MPH range. This leads us to a pitch called the “eephus,” an intentionally slow and arcing pitch meant to confuse hitters. The etymology of the word is just as confusing as the pitch itself, which is almost never thrown except in dire situations such as a position player taking the mound in a lost game.
This takes us to the slowest pitch ever thrown in the pitch-tracking era, a 30.1 MPH beauty by utility player Brock Holt who, in a 10-year career, played every position on the diamond besides catcher. This, of course, includes pitcher in a 9-run deficit to the Oakland Athletics in 2021. The pitch floats across to home plate where the Athletics’ Matt Chapman tracks it, hits it 100 miles per hour off the bat to a gap in left-center field, and then gets greedy for second base and is thrown out in an act of instant karma. The slowest strike ever thrown, a 31.1 MPH pitch that dropped from 12 to 6, was also from the glacial hand of Brock Holt in that same outing. Despite what the new Automated Balls and Strikes system or broadcasted baseball would lead most fans to believe, the strike zone is a three-dimensional object: a projection of home plate from the batter’s knees to the letters on their uniform which became more strictly defined as percentages of a player’s height in 2026. Typically, pitches are flat enough to where we don’t need to consider this. However, these Brock Holt eephuses soar high enough that they register significant vertical movement above home plate. Watching the video back makes me confident that the ball clips the middle-right corner of home plate, and that home plate umpire Chris Guccione correctly called the pitch. Good job, blue!
The Imperfect Games
The perfect game is one of the rarest pitching feats possible, requiring a pitcher to retire the minimum number of batters in a single game. A team can also do this, but a “combined perfect game” has never happened in MLB history like a combined no-hitter has. The “minimum amount” is usually 27, but if a game goes into extra innings this number increases. Every game a pitcher starts has potential to be perfect but is tarnished the second they give up a hit, walk, or their team gives up an error that results in a batter getting on base. However, managers aren’t pulling starting pitchers after a single gaff removes them from perfection and the “batters faced” statistic for the outing begins to tick up past the minimum. Every time a pitcher errs in some way -- hit, walk, or team error -- this statistic and the ratio of batters faced to innings pitched increase. Double and triple plays can curb this by effectively removing a batter (or two, for a triple play) faced, but batters faced is still a good statistic to compare to the perfect game as the ratio of batters faced to innings pitched in a perfect game will always be a clean 3.0, as there are three outs per inning and each batter is worth one out. So, who are the poor pitchers that were left in as hitter after hitter got the best of them? The answer to this question changes based on the constraints of the problem.
If we look at complete games only and look for the most batters faced while having a batters faced to innings pitched ratio of 3 or more, the historical answer is Jimmy Callahan of the 1903 Chicago White Sox who was left to face 61 batters over 11 innings for a miserable ratio of 5.5 batters per inning. However, pitching in the early 1900s was far different than it is today: lower-pressure environments and less optimized biomechanics meant that pitchers were regularly throwing complete games and topping 200 pitches thrown. If we look past integration in 1947, hall-of-famer Bob Feller was left with the task of facing 50 batters over 9 innings in a 1952 outing versus the Philadelphia Athletics. Despite giving up nine runs, his Cleveland team still won by a score of 21-9. Past the turning of the millennium, this dubious title goes to Cy Young winner Chris Carpenter who faced 42 Marlins as a member of the 2001 Toronto Blue Jays. Modern managers have become savvy to saving their pitchers’ arms, and the aim of finding the “imperfect game” in this manner becomes trickier as time marches forward.
However, if we loosen the constraints and focus on maximizing the ratio of batters faced to innings pitched, we get different results. To prevent “infinite ERA” players from appearing I still impose a limit on innings pitched to greater than or equal to 5, which is around the length of an average start. The top game in this category is an ugly-sounding loss by 22-year-old Nick Altrock in 1898, where the poor kid was left to face 37 batters in 5 innings for a ratio of 7.4 less than a week after his 22nd birthday. He gave up 15 runs, 10 earned, to the Boston team (who are now the Atlanta Braves) as his Louisville Colonels fell 4-24. The integration-era answer is the Galen Cisco of the Boston Red Sox who faced 36 batters in 5.1 innings for a ratio of 6.8, and the answer after 2000 is Jesús Sánchez, an innings-eater for the late ‘90s and early ‘00s Marlins who was left to face 33 hitters in 5 innings for a ratio of 6.6. For purposes of comparison, in the 2025 season there were an average of 4.26 plate appearances per inning. Altrock, Cisco, and Sánchez struggled in these games to the point where they had to essentially earn between 4.5 and 5 outs per inning if they were pitching to a league-average level. All the while, their managers kept them in the game -- for either a humiliation ritual, saving other pitchers’ arms, resolving an already-lost game, or otherwise.