
Demystifying Mastery Gain in League of Legends' New System
Written 05-27-2024
Introduction
On May 15th, 2023, the Champion Mastery progress system was changed in League of Legends. Instead of the "mastery" of certain characters being tracked by points and levels from 1 to 5, where around 970 points were gained per 35-minute win and 21,600 points were required for level 5 and levels 6 and 7 were disjointed from the point system and earned by achieving high grades in games, the system was uncapped and champion levels can rise infinitely as players log more games on certain characters. This description paints very broad strokes and doesn’t include everything that’s changed. The most important change for calculating the formula of mastery gain is that the mastery points gained after a game is no longer dependent on a team’s overall performance--rather, only individual performance is factored in. Before, it was a bit murky as to how mastery was calculated as every member of a team earned the same total. Now, with individualized totals, we can isolate variables.
This attempt to calculate the mastery gain formula is, selfishly, to refine how I calculate progress on MSheet, my Google Sheets-based League progress tracker. I used 970 as a benchmark with the old system based off of a 100-win study I did in August of 2021, shortly after I decided I wanted to achieve Mastery 7 on every character. I’ve been playing League with this goal in mind for nearly three years, and with the mastery system changes the goalpost has been drastically moved and I want to be realistic about how long the new goal of hitting Mastery 10 on every character will take me. What was once achievable for me by 2026 is now being pushed into the range of 2028 to 2031--a four-year window. This isn’t an attempt to game a system, attempt to figure out how grades are calculated in perfect detail, or spur change within Riot to make the calculations more opaque or transparent. I just want to be able to track and project progress for myself (and others) accurately.
The Assumptions
As with any study, I know that I’ll have to have a base set of assumptions that I work through as I try to derive a formula for the data coming in. Some of these assumptions have been confirmed by Riot in their various update posts, and some of these assumptions are ones that I am placing to guide how I analyze the data collected. They may or may not be correct once the analysis is all said and done. They are as follows:
- Team performance does not impact mastery gain--only individual performance.
- "Base Mastery Gained" is calculated as some base value plus a constant rate of mastery points per second, times the length of the game. (Note to reader: In the old Champion Mastery system, this was logistic, but I’ve determined it to be linear in the new system.)
- Mastery Grades given at the end of each game are stored as a multiplier that is applied to Base Mastery Gained to return Actual Mastery Gained (or just "Mastery Gained").
- Playing with 2 or more players in a premade party multiply the mastery gains by some percentage, as specified on Riot’s support article.
- Losses return some percentage of what a win would return.
- Mastery Gain is deterministic (i.e. same variables result in same result -- there is no randomness in the mastery gained).
- Mastery formulas between Summoner’s Rift and Howling Abyss are the same.
With these assumptions in tow, I went to collect data. At first, I did this as a solo effort but thanks to a few people around the League Challenges community (especially Wayne), I was able to gather around 350 games of data within around two weeks. For this analysis, I’ve discarded games that lasted less than 600 seconds (10 minutes) as I am only concerned about the range of average game times, and any game that lasts less than this is either intentionally lost by a 5-man party, or an anomaly.
The Dataset and The Aim
The data that I’m looking for consists of the following fields:
- Date: The date the game was played.
- Result: Whether the game was won or lost.
- Grade: The grade earned at the end of the game, ranging from S+ to D-.
- Length: The length of the game, in seconds.
- Mastery Gained: The mastery gained as reported on the end screen, in points.
- Party Size: The size of the player’s premade party.
This information allows me to tease apart the individual variables that I believe affect the mastery formula, as described above. The date played is to match the date to a patch within the game in the case the mastery formula suddenly switches up between patches.
There are two main aims I have with the data: to analyze the effect of game length on mastery gain, and to analyze the effect of grade on mastery gain. The first one is easy enough to do broadly--I load all of a certain type of game (win or loss) in a plot of mastery gain versus game length (I originally used the natural log of game length, which is how I determined gains were linear as opposed to logistic within the new system) and am able to find a line of best fit which approximately maps mastery gained.
The second one is where the data becomes a bit tricky to analyze, as I need two types of paired data points: those with the same length, same grade, and same party size to compare mastery gain, and then those with the same length, same party size, and different grades to compare mastery gain. The data that I have has a few examples of such games, and as a result I can pull from a few examples to hypothesize how grade affects mastery gain.
Party Size Assumption
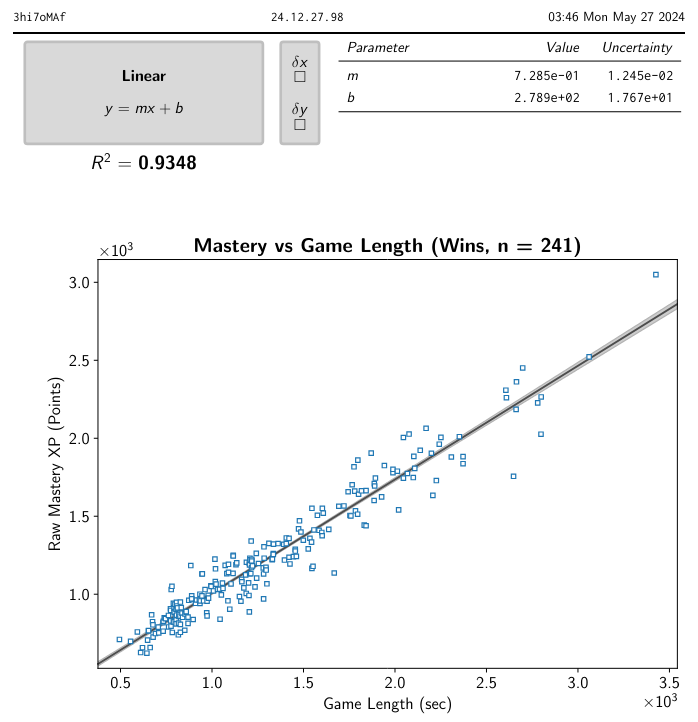
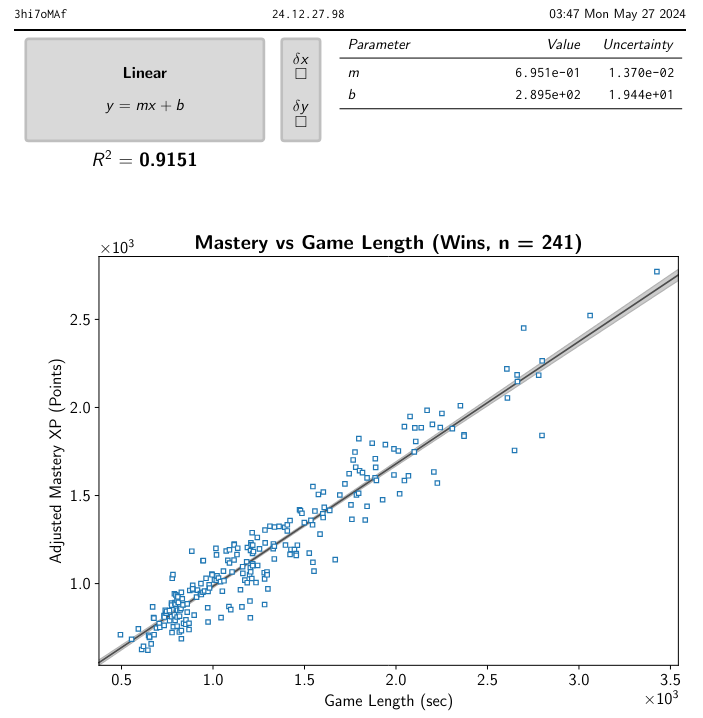
On the Riot support article, it is stated that users gain anywhere between 2% - 10% bonus mastery for queueing up for a game with a premade party, with larger parties resulting in larger Mastery gains. However, in analyzing the data I would like to refute this assumption before going any further--the bonus is not being properly applied. In addition to adjusted points having a weaker correlation to length than non-adjusted points (R^2 = .9348 versus R^2 = .9151), I have a couple examples which I list below that would lead me to believe the bonus is not being properly applied:
- Example 1:
- Game 1: 22:15, Win, S, 1261 mastery gained, party of 3
- Game 2: 22:15, Win, S, 1255 mastery gained, party of 5
- Example 2:
- Game 1: 11:09, Loss, C+, 311 mastery gained, party of 1
- Game 2: 11:09, Loss, B+, 331 mastery gained, party of 5
- Game 3: 11:09, Loss, A+, 367 mastery gained, party of 5
- Example 3:
- Game 1: 13:24, Win, S, 834 mastery gained, party of 5
- Game 2: 13:24, Win, A, 810 mastery gained, party of 1
- Example 4:
- Game 1: 16:13, Win, A+, 956 mastery gained, party of 1
- Game 2: 16:13, Win, B+, 861 mastery gained, party of 5
In each of the examples I’ve noted above, the lengths of each game are the same. While the grades differ, if we account for the percentages listed by Riot there are instances where lower grades would result in higher mastery gains if the player was playing solo and instances where a player would gain more mastery solo than in a party, which is counter-intuitive and leads me to believe that the party size bonus is either not applied, or not being applied properly. This may be due to the Game Score difference that I am about to mention below, but I think this is unlikely due to the size of the differences I’ve seen above. Thus, for the rest of this analysis, I’ll ignore this assumption.
The Analysis
As mentioned above, when comparing mastery gains across grades I need to find pairs of games with the same result (win/loss) and same length to isolate the effect of grades. In doing this, I was able to generate around 30 pairs of games that satisfied these conditions to look at. There were a few interesting pairs that have led me to believe that grade is a bit more nuanced than the system would initially lead me to believe:
- Example 1:
- Game 1: 13:31, Win, S, 912 mastery gained, party of 2
- Game 2: 13:31, Win, S, 912 mastery gained, party of 2
- Example 2:
- Game 1: 24:15, Win, S-, 1288 mastery gained, party of 5
- Game 2: 24:15, Win, S-, 1277 mastery gained, party of 5
In the above examples, I have a pair of games with identical conditions that led to two identical gains, and then a pair of games with identical conditions that led to different gains. Since I doubt Riot stores the length of games to more specificity than the second (and that this small of a change would drastically affect the mastery gains), it has to be the grade that causes the difference. This leads me to believe that grades are determined by some “Game Score” calculation, and the letter returned is a range of game scores. Grades are known to be percentile-based given the criteria of champion and role, so I am also assuming the ranges returned by these Game Scores are dynamic by both champion and role and changing percentiles as more games are played. What I am not looking to do is dive into a calculation of Game Score--that opens up a quite-gameable can of worms that I do not want to look into. I am basing my naming of this number as Game Score based on the baseball statistic. I think that Mastery Gain is directly calculated by Game Score, not grade, and as a result we can see different gains for games which look to have identical conditions (but actually don’t, as grades correspond to ranges of Game Scores).
Because of this, grade becomes an unreliable metric to use--however, we must use it as it is our only indication of Game Score. To find the effect of grade on mastery gain, since we assumed all mastery gain is linear and threw out our assumption of party size affecting mastery gain, we can take the average of both mastery gained and game length for a certain grade and then normalize the data for each grade by multiplying the aforementioned numbers of each by a factor such that we have the average gain for a 30 minute game for each grade. Using these results, and assuming that the multiplier is linear as Game Score (and therefore, grade) increases, we can get an adjusted mastery gain that is mostly independent of grade.
Using the above constraints, I found that in the pairs of games mentioned above there is an average gain of around 1085 mastery points in a 1105-second game, and each rank gained increases this amount by 24.52 points, or by a factor of 1.022. The average grade in these paired games was 3.15 on a descending scale (S+ = 1, S = 2, etc.), meaning that the average grade was just below a S-. This number, 1.022x per rank gained (or 1 / 1.022 = 0.978x per rank lost), is what we’ll be using moving forward.
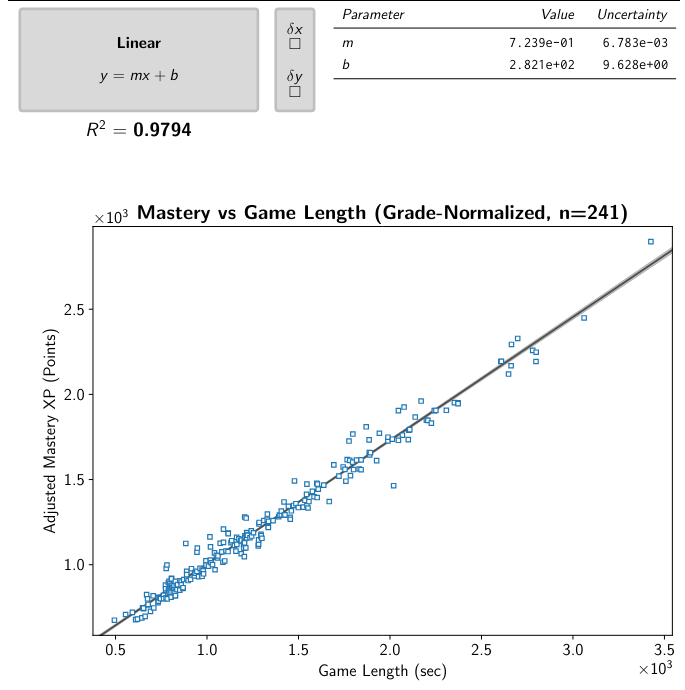
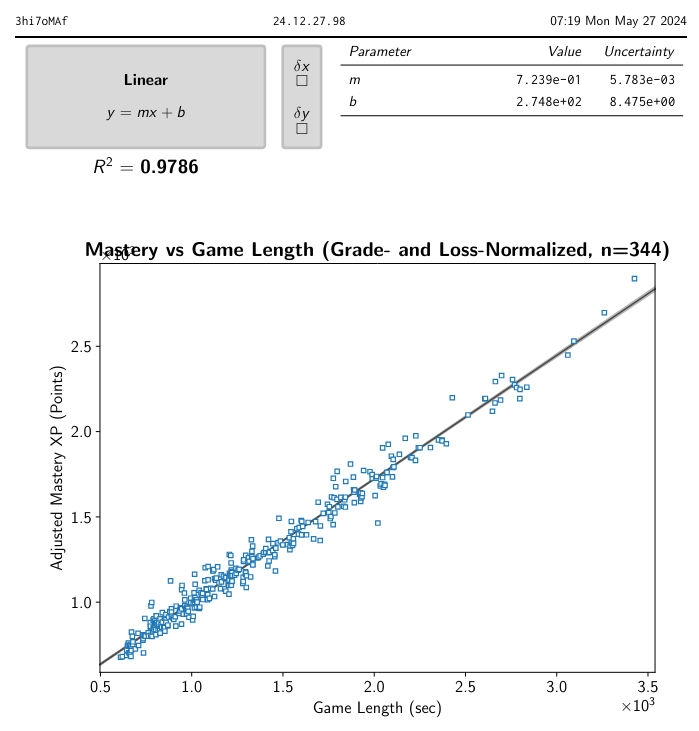
The average grade in the entire data set for wins is 3.357, meaning we will want to normalize the grades around this number. This means to convert a mastery gain and grade pair to a “normalized” number, we’ll apply our rank factor a number of times based on the grade via the formula (1.022)^(T), where T is the difference between the game’s grade on our descending scale and our average grade. As an example, a S grade will result in a T value of 2 - 3.357 = -1.357, making us multiply our gain in the S performance by (1.022)^(-1.357) = .9709 to bring it down to average. When applying this normalization to our data, the correlation between mastery gain and length becomes much tighter (R^2 = .9794 versus R^2 = 9348).
Now that grades are normalized, we simply take the line of best fit as our formula

We, of course, want to include grade in this formula--meaning that our final formula for a win actually looks like
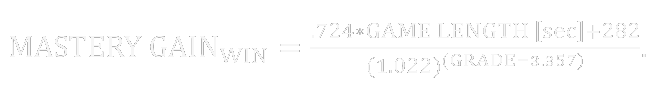
But, how about losses? We can calculate the percentage of mastery points a loss gives compared to a win by normalizing the grades of the losses the same way we did for our wins above, and then comparing the derivatives of the lines of best fit. For wins, we gain .724 mastery points per second of elapsed game time plus 282 base points, and for losses we gain .363 mastery points per second of elapsed game time plus 127 base points. If we want to look at losses, that is the line of best fit we’ll use on the numerator, giving

and when normalizing losses such that they are worth the same amount as wins (by multiplying the mastery gain by 2), we bolster our sample without losing much correlation as per the R^2 value. Of course, since Mastery is displayed as an integer, we’ll want to round the result to the nearest one for both formulas. When comparing to the actual mastery gains received, this formula ranges from spot-on to 19% inaccurate, with an average of 3.5% inaccuracy. This is an error that I am willing to accept, as I believe that this is not the way mastery is really calculated--rather, I believe it actually looks something like

where the game score turns into some multiplier that affects the mastery gain. This is also better than the projections I had in previous versions of MSheet, so I’ll be moving forward with it. There are absolutely refinements and optimizations that can be done with the constants in this formula, but I am fine leaving it as-is for now.
The Conclusions
In diving into the weeds of mastery gains, I’ve come to the following conclusions based on the data I’ve received and collected, and editing the assumptions used earlier:
- Team performance does not impact mastery gain--only individual performance.
- Mastery gains in the new system are linear, not logistic as they were previously.
- Mastery Grades given at the end of each game based on a Game Score earned, which is converted into a Grade based on a range of values for each grade for each specific champion-role combination.
- Playing with 2 or more players in a premade party does not multiply the mastery gains by some percentage. This may be incorrect and differences I’ve seen may be attributed to Game Score.
- Losses return around 50% of what a win would return.
- If the Game Score hypothesis is correct, Mastery Gain is deterministic (i.e. same variables result in same result -- there is no randomness in the mastery gained).
- Mastery formulas between Summoner’s Rift and Howling Abyss are the same.
If you have any questions or qualms with my analysis or the data, feel free to contact me! My information is on my home page. The data is available in a public Google Sheets workbook here, with examples used in this article highlighted in light yellow. I would again like to thank Wayne for his help in gathering data and helping me work on MSheet as he works on his own web-based progress tracker, alongside the BFF Institute and anyone who provided data to me or Wayne.
To cap it off, this is something I'll probably revisit in the future. The new mastery system is less than two weeks old, and the data set I'll be able to analyze will only grow with time--and as it grows, my lines of best fit will become more and more accurate. I can only hope that Riot one day just shows us the game score instead of giving us a grade for perfectly accurate calculation, but this will have to do (and I understand why it's done as such).