
Pokemon Drafts from 2005 and the Quest for the Perfect Statistic
Written 04-27-2024
Introduction
As I’ve grown older, I have become more aware of my tendency to fall fast and hard for new interests. I feel that they generally follow a theme, but if I find something that is sufficiently stimulating to me I already know that I’ll wind up sinking a lot of time into it.
A general theme that these time sinks of mine follow involve statistics and data analysis. Maybe it’s a product of the baseball research I’ve done and poring through Baseball Reference, but some of the things I’ve sunk the most man-hours into involve taking a data set and trying to extrapolate conclusions from it—whether valid or not. In the summer of 2021, for example, I became very curious about “Century Pong,” a version of beer pong that involves 120 cups and teams of multiple people. My small, rural college in Minnesota had an annual student-run league, of course, and one of my closer friends during my senior year of college was the commissioner. I was fascinated not only by the premise of the game itself but also the immense amount of data that could be collected from it. How many cups did the average player get? Where did they aim on their first few shots? What was their beer-pong equivalent of a batting average? These questions turned into tougher ones – how could you determine the MVP of the league? How can you quantify defense? I unfortunately don’t have access to the document that I had created, or the simulation of a century pong game I wrote in Python, but I had created new stats with wacky abbreviations to help quantify player talent. In the fall of 2018, when I first arrived at college, I had multiple spreadsheets detailing games of hearts played on my dorm floor and even created a rating system loosely based on ELO. MSheet is something I have sank hundreds, if not thousands, of hours into to create new metrics to track progress in League of Legends.
This is all to say, when I discovered that there was an untapped dataset involving something I was interested in – the critically acclaimed game Pokemon Emerald from 2005 – I was all ears. I’ve been in and out of various communities centered around Pokemon for most of my life, and I decided to join a tournament based off the suggestion of a streamer that I watch, LRXC. I lost every match I played in the tournament for a quick 0-3 record and early elimination, but I fell in love with the format and all the data that could be gathered and analyzed from it.
I am not good at this. This article is not my thoughts on matchups and the game within the game, and the why of why the numbers look the way they do. It is more of a proof of methods, and the why of the statistics themselves.
The general gist of the rest of this article will be talking about ADV Draft, or “Advance Draft”, based off of the Gameboy Advance system the game was released on. This is a format where a shared pool of most of the 386 Pokemon available in Pokemon Emerald are selected exclusively by eight players. Once a player selects a Pokemon, they become unavailable to the rest of the players. Drafts consist of eight rounds and players have a “budget” of 90 points that they can spend on Pokemon – for example, the strong Metagross is worth 18 points (the highest total), the slightly weaker Blastoise is worth 11 points, and the very weak Beedrill is worth only 3 points. Once teams of eight Pokemon are chosen, players battle each other six-on-six by having the partial information of the Pokemon their opponent has but not what moves they know, what their stats are, nor which six of the eight they will actually bring.
In my opinion, the partial information being available rocks and breeds innovation I find super sick. In the first game of the tournament, Emerald Open IV, I watched a Smeargle lay down a layer of spikes, transform into an enemy Weezing to eat a Sludge Bomb that would have killed it, and then kill the enemy Snorlax. ADV is one of my favorite Pokemon formats, and the drafting element demands a set of skills that I very much do not have but are awesome to witness.
Data Collection and Storage
The data collection part of this analysis was something that I initially thought would be rather limited. I knew the tournament was called Emerald Open IV, meaning that there must have been opens I through III, but I thought these were the only data sets I’d look at. As it turns out, there’s been a multitude of ADV draft leagues throughout the years, and I feel like I’ve only scratched the surface still. At the time of writing, Emerald Open IV is still ongoing, but the final data statistics will look something like:
10 Tournaments104 unique drafts1710 - 1711 unique battles (depending on tournament results)816 entrants
With each draft typically having 64 picks, drafts alone gave me a near-7000 element data set to analyze. Excellent.
First thing first: due to a database corruption error of the Pokemon simulator these battles take place, all of the replays between 2020 and 2023 were lost to time. This is perhaps fortunate for me as this would involve going through a ton of log files and asking a lot of people questions about tournaments from years ago to pull advanced analytics for certain Pokemon such as usage rate. The assumptions I carried out from this point on were that all eight Pokemon drafted to a team were prepared for and therefore all counted for purposes of battle statistics such as win rate.
I scoured through the Google Sheets these tournament results and draft boards were stored in and transferred them to my own document. Seeing as I work with relational databases at my job, I had a pretty decent idea on how to store things. I first created a spreadsheet called “Combined Draft”, which held draft results as they were chosen, separated by tournament, player, and overall pick. A lot of manual entry here. I also made sure to assign every unique pairing of tournament and player an “Entrant ID” that I could reference throughout the analysis, alongside the ability to exclude certain tournament results if desired.
Sample storage of the first round of a draft.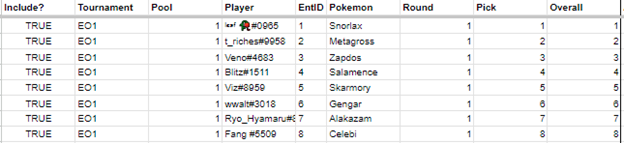
After all of this was done, I collapsed this data such that each player and their team had a single row. For trades that were done in the middle of the tournament that I could track, I created two separate Entrant IDs for each team. This is also where I entered how each player fared at their respective tournament in terms of wins, losses, and games above or below .500 (this will be important later).
Let's not talk about this one. Breloom and Heracross don't make a good duo!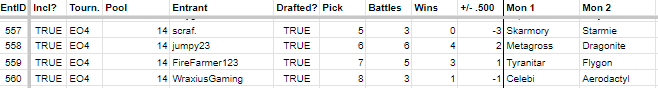
Finally, I had to approach the biggest data entry hurdle of them all: uploading battle data. I decided to give each battle a unique ID to help keep track of counting. I also separated each entrant and the victor into three columns apiece for easier analysis down the line. There is a row for every single battle I could either scrape the replay for or gather from some tournament spreadsheet.
Sample storage of some battles from the playoffs of Emerald Open III.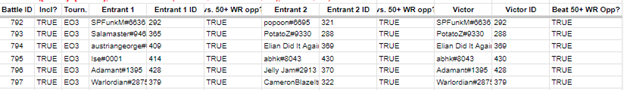
Now that all the data was stored properly with ways to link teams and battles by Entrant ID and Pokemon used, it was time to get into the analysis.
Initial Analysis
Emerald Open IV was my first exposure to both this data and competitive ADV Draft as a whole, so I remember taking things a bit easier at first when beginning analysis. I kept track of simple counting and rate stats, such as draft positions (highest, lowest, average), times drafted, battles used and won, draft rate, and win rate. Around when the initial Emerald Open IV drafts finished, I felt an itch to do some data visualization and as a result created an infographic that wound up being the first in a series of four. In the process of creating this infographic, I thought back to various NFL and fantasy football drafts I’ve watched and tried to figure out ways to quantify two common concepts within a draft—reaching and stealing. A reach is a pick that was selected too early and would have probably still been remaining when the draft wraps back around, while a steal is the opposite phenomenon where a player gets a pick that really should not have been available.
Quantifying reaches were easy enough—if a Pokemon is drafted at the 20th spot on average, and a player picks it with the 4th pick, it’s a clear reach of 16 picks. Therefore, reaches are calculated as the difference between these two numbers: average draft position (ADP), and the actual overall pick. However, steals were a bit trickier. Getting what should have been the 4th pick at 20th is obviously quite the steal, but using the reach logic mentioned earlier someone getting what is typically picked 44th at the 64th slot would be a “better” steal. This is not the case, as the former represents something more valuable tumbling down the draft board—because of this, I chose to quantify steals as the quotient of the pick a Pokemon was chosen and its ADP.
Initial conclusions were interesting to see: it was fun to point and laugh at the person that took a 6th round Pokemon in the 2nd round, and seethe at the person that got the game-defining Pokemon Zapdos in the beginning of Round 3 and Swampert at the end of Round 4. However, with hindsight, despite not being familiar with the data set prior to plunging into things I could notice trends that are starting to click as I write this article. The rise of value of Raikou and Glalie and the general decline of Tyranitar and Magneton are examples.
As the tournament battles got played, I made more infographics looking at even more trends: falls and rises in win rate between historical data and this tournament (ability to filter data by tournament coming in huge). Within the context of a single tournament, the rate stat of Win Average (wins divided by drafts) is proportional to win rate and a good way to quantify which Pokemon are looking the best (and, inversely, the worst). I use Win Average to highlight top performers from the first half of the tournament, but also do something on the second infographic that I believe has set me up for future analysis. In this infographic, I have two sections on the second infographic called “Lord of the Spin” and “King of the Spikes.”
A Discussion on Analysis
In ADV Draft, there is a move called Spikes that lays dangerous spikes below your Pokemon, making anything without the ability Levitate or the Flying type take damage when they switch out. Switching is an integral part of the game, meaning that teams are quite punished when spikes are laid down. Spikes can be laid up to three times, making Pokemon lose either 1/8, 1/6, or 1/4 of their maximum health upon switching in.
However, there is a solution to Spikes: Rapid Spin. This move is a weakly-hitting move that clears the users’ side of any hazards on the ground, including Spikes. The distribution of Spikes and Rapid Spin are both limited to certain Pokemon, creating a struggle both within the context of a single battle and within the entire draft format. Once the first “Spiker” or “Spinner” is taken, it often becomes a panic to try and scoop up the best available Spikers and Spinners remaining. This is akin to a run of quarterbacks going off the board in a football draft.
The fact that the roles of “Spiker” and “Spinner” are so easily defined by whether the Pokemon gets the move or not allows for easy comparison between them. In the infographic, I rank the Spikers and Spinners by Win Average—and it is in this comparison that I think the work I’ve done thus far is the most meaningful.
A quick side tangent—I’m a physics guy first and foremost, and still learning corporate jargon despite being nearly two years into my current job. A phrase that still jars me whenever I hear it is “comparing apples to apples” in the context of data. Regardless of the type of data, the concern is that the data being compared for analysis isn’t meaningful to compare, and this is something that could be worth looking out for in this data anyhow.
The Pokemon Dugtrio and Skarmory had bad performances in the first stage of the tournament, each having a 12.5% decrease in win rate compared to their historical number. These two do entirely different things though: Dugtrio is frail, traps Pokemon using its ability Arena Trap, and dies, while Skarmory is a Spiker that can use moves to force enemies to switch onto its spikes and generally wants to live forever. Could there be a shift in general consciousness that made both of these Pokemon perform poorly? Maybe—and the win rate stats do still have interesting value as indicators of which Pokemon did perform poorly—but it would get us closer to the ‘why’ to look at trends of Skarmory versus other Spikers, and Dugtrio versus other fast but frail attackers.
There are, of course, other archetypes besides Spinners and Spikers that are popular in ADV Draft. Bulky water types with high defenses and health, often just called “Bulky Waters,” are very popular in the format as well. But, how does one define ‘bulky’? There are two types of attacks in ADV Draft, physical moves and special moves, but some Pokemon have the stats and move availability to run both. Are they “Mixed Attackers,” or does one side of the spectrum define the archetype for that Pokemon? If a predominantly physical attacker like Tyranitar takes the move Fire Blast to hit Forretress, does that make it a mixed attacker? Questions for another time, perhaps.
Advanced Analytics: Duos
Now that the groundwork for the data was all laid out, I had the opportunity to start building on it and trying to create metrics that measure more specific aspects of both drafts and individual Pokemon. The usual thing I try to do whenever I come across a new data set for a game like this is create its version of baseball’s Wins Above Replacement, or WAR, a number that approximates player (or in this case, Pokemon) value. For the beer pong games, this was Cups Above Replacement, and for the games of hearts played on the dorm floor my freshman year this was a combination of factors that led into the player rating.
However, this is not what I did. My mind immediately went towards teammate synergies and how common duos within the main ADV competitive format, called ADV OU or “Advance OverUsed”, fared within a draft format. Duos are often parts of bigger cores where they are able to build off of other common pieces—however, in a format where a player has to worry about a shared pool, this becomes significantly trickier. I had to create a separate spreadsheet on the workbook such that the cartesian product of over 81,000 combinations (286 * 285 Pokemon chosen in at least 1 draft) wouldn’t get me banned from Google Sheets.
Some of Skarmory's most common partners in crime. Qualifier: 9 or more duo drafts.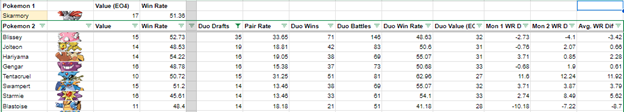
The “Duo Analysis” spreadsheet takes a Pokemon and shows the amount of drafts they wound up on the same team, a “Pair Rate” that shows the percentage of how many teams containing the second Pokemon also contained the first in the duo (i.e. Blissey has been paired with Skarmory in 33.65% of Blissey drafts), wins, battles, win rate, combined cost, and then the real juice of the matter: win rate difference between each Pokemon’s historical win rate and their win rate as a duo, and the average of these differences. These numbers answer questions of whether a duo is strong because of both Pokemon or whether there is one carrying the pair, or whether the duo is better off apart. I haven’t taken too many digs into this data at the time of writing, but am curious to see what these numbers return and whether or not they align with expectation and public perception.
This spreadsheet took quite a bit of time to make, and made me feel like a cosmic-brained genius when it all came together. As spreadsheets tend to do: there’s nothing quite like organized data.
Advanced Analytics: FrAUD Index
A few times, I asked the tournament community what statistics they would be interested to know about. I’ve used it a few times to guide my analysis and the little data tidbits that I’ve left in the server’s chat, like a truly boring Easter Bunny. One answer to this question concerned the Pokemon that are “frauds”—those that are able to beat up in a player skill gap, but struggle against those that actually know what they are doing. I immediately got to work, with the first thing I came up with being the name: Free Advantage versus the UnderDeveloped Index.
After coming up with the name, I hit a wall for a day trying to figure out how to analyze this. It required a complete restructure of the spreadsheet (as I described earlier—that all was post-rebuild), a lot of tinkering with the formulas, a few spreadsheet crashes, and an amount of time spent sitting in my desk chair like The Thinker that I don’t care to admit. I eventually decided on simply taking the difference of win rates between a Pokemon’s historical win rate and a Pokemon’s historical win rate versus drafts boasting a 50% or higher win rate. This difference is then compared to the average decline in win rate between historical values and historical values versus opponents at or above .500, and the difference there results in the FrAUD Index.
The top frauds! Qualifier: 50% or greater Draft Rate.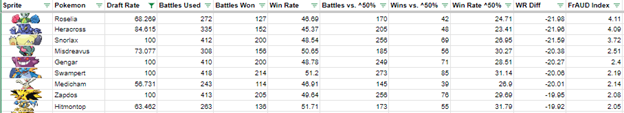
I am immediately greeted at the top by Roselia, a low-tier Pokemon that has Spikes but is not particularly bulky or strong, Heracross, a Pokemon with a 4x weakness, and Snorlax, a strong Pokemon with a few very exploitable weaknesses. This is a metric that aims to show how susceptible Pokemon are to being effectively dealt with by high-level players.
This is also why there are columns everywhere in the battle sheet about being at or above .500.
Advanced Analytics: The Perfect Statistic
After working on getting Duo Analysis stood up and the FrAUD Index calculated, I decided to turn my head towards creating the ADV Draft equivalent of WAR. For a long time while I was waffling about and constructing the spreadsheet, I was using a measure I now call Value Per Point, or VPP, to determine the value of a Pokemon. This is determined by multiplying the average point cost of the Pokemon in a draft by its win rate—this prioritizes Pokemon designated as valuable by having lofty point costs alongside rewarding win rate. With this metric, we see around what I would personally expect with high-cost Pokemon crowding the top of the standings. However, there are interesting blips within the data, such as the 13-point Gyarados outvaluing all 14-point Pokemon, or the 12-point Espeon being considerably above every 13-point (and some 14-point) Pokemon.
However, is the cost of a Pokemon truly indicative of its value? A measure that isn’t incorporated in VPP is draft rate—if a Pokemon is valuable to a team, a player will want to draft it, meaning that draft rate should also play into things for this WAR-equivalent value statistic. I tried taking a look at simply multiplying both win rate and draft rate but the resultant value, that I call WDR2 since it’s two rates, seemed to be dominated by draft rate and it wasn’t a truly equal split between the two. I am of the belief that all three factors (win rate, draft rate, average cost) are important to determining a Pokemon’s overall value, and want to try and make them as equally impactful as possible. To not make draft rate dominate in this calculation, instead of centering the function of draft rate and value around 50% it needed to be centered around a value determined by the format itself.
My idea when creating a value calculation was to make some arbitrary number (I chose 10) a Pokemon’s “average” value. To do this, it’d have to cost an “average” amount of points, have a 50% win rate, and typically appear in 95% of drafts. This last part was determined by taking the chance a Pokemon won’t get drafted, applying it to the eight different players in a draft pool by raising it to the eighth power, and setting this chance equal to 5%. This resulted in a value of 31.2% for our desired draft rate. Additionally, I did not like the idea of using linear functions in this calculation—if a Pokemon is drafted 0% of the time, the gap in value between it and the Pokemon drafted 31.2% of the time should be much larger than our average Pokemon and one drafted 62.4% of the time. Should there be a discernable difference between a Pokemon drafted 93% of the time, 96% of the time, and 99% of the time? I decided no (at least, not to the extent this would become visible with a linear function). Instead, I used my favorite function to generate some curves for value versus draft rate and value versus win rate, centering them at appropriate values. I made the curve for win rate much steeper than the one for draft rate, as early results setting them equal gave results like the 13-point duo of Gyarados and Machamp being the 3rd and 4th most valuable Pokemon of all.
Once these curves were set, giddy I had opened Mathematica for the first time in years messing around in this silly spreadsheet, I assigned arbitrary values to the points system as I also did not feel comfortable with it being linear (the gap between 1- and 4-point Pokemon is indistinguishable when compared to the gap between 15- and 18-point Pokemon, for example), fit it to a quartic function to have enough of a fit without matching my values exactly, and sent it on its way to be multiplied with the previous product. I call this calculation pCV (Points-Adjusted Composite Value), and the curves not considering points CV.
All of the functions I talked about above are also normalized so these values don’t fly off into the thousands. They are meant to be compared to averages—which I have set to 10, as mentioned earlier. The accuracy of these calculations is something that I agree with, but I think all four tell an incomplete story that probably won’t ever be completed.
In Conclusion
As I just mentioned, I was absolutely giddy cracking open Mathematica and Wolfram|Alpha for the first time in years. My job is in healthtech data integration, not physics, and as a result I haven’t itched that part of my brain in what feels like a very long time. Granted, it was less than two years ago, and the glorified rock-paper-scissors with mascots that is Pokemon is not physics, but there is something that I deeply appreciate about the complexity of this data the same way that I appreciated the complexity of things like fluid dynamics that were presented to me in college.
Acknowledgments
I’d like to specifically thank the internet users Khaz, LRXC, HClat, Electric, Dazey, and the entire Emerald Open staff for great conversations around the data and analysis, alongside my wonderful poolmates Voidvolta, Davo4, and King Raska that thoroughly beat me by a combined score of 12 Pokemon remaining to zero. I’d also like to thank you! For reading this stream of consciousness. Appreciate it and you!